Contents
- Defining eviction and its consequences
- Past studies highlight the link between evictions and Black communities
- The state of evictions in Black-majority neighborhoods
- Visualizing eviction and eviction filing rates across different types of neighborhoods
- How to avert the coming eviction crisis
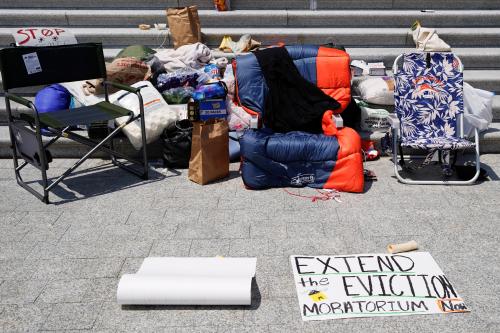
According to a 2020 report by the Aspen Institute, an estimated 30 million to 40 million people in the U.S. are at risk of eviction due to the COVID-19 housing crisis. Previously, a national moratorium on evictions from the Centers for Disease Control and Prevention (CDC) protected these households from losing their homes. But on July 31, that moratorium expired.
If past trends hold, the upcoming eviction crisis will lead to higher rates of COVID-19 infection, especially as new variants emerge. The scale of this problem exposes fundamental problems in our labor market and social safety net.
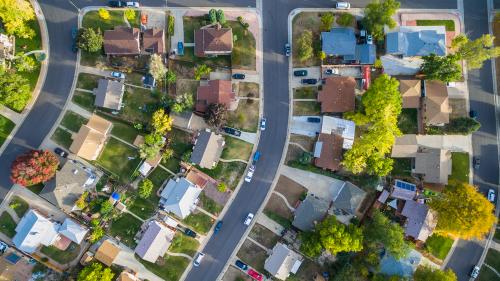
In this piece, we show that the eviction threat looms the largest in Black-majority locales, creating the potential to decimate entire neighborhoods.
Defining eviction and its consequences
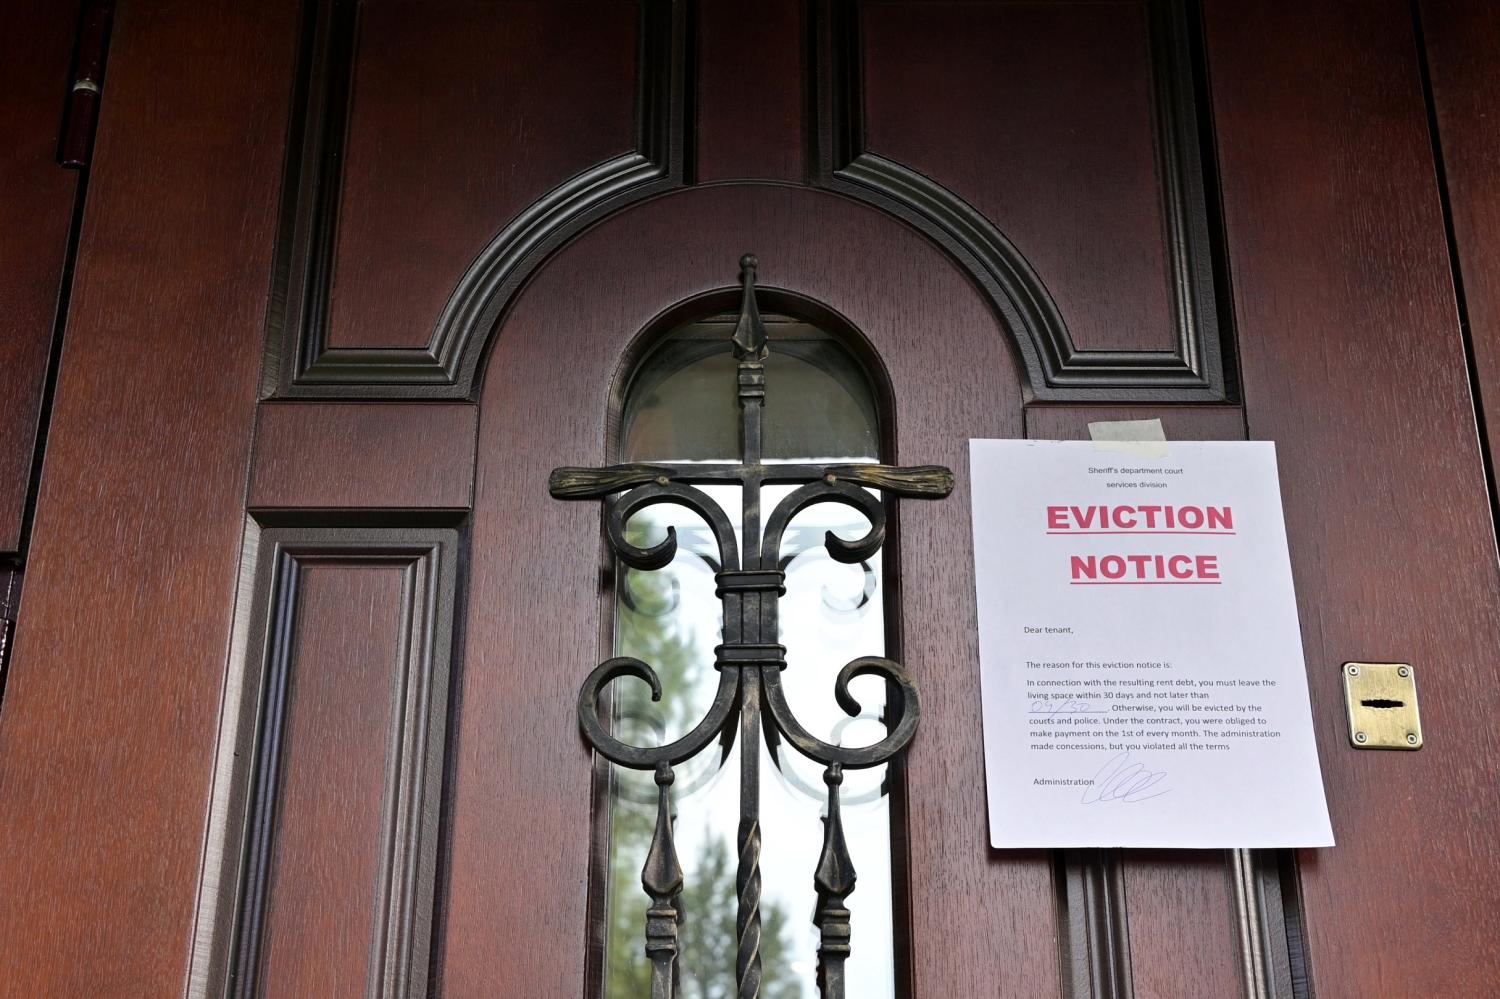
Eviction, or forced relocation, is a critical and understudied mechanism that drives residential mobility, particularly in inner-city neighborhoods among low-income families. According to the U.S. Public Health Service Act, eviction means any action by a landlord, owner of a residential property, or other person with a legal right to pursue eviction or possessory action to remove or cause the removal of a tenant, lessee, or resident of a residential property from said residential property. A landlord must have legal cause to make a tenant vacate a rental unit prior to the ending of the term of tenancy, with the most common causes relating to the nonpayment of rent, “nuisance laws” involving too much usage of 911 services, the rental unit faces health or code violations, illegal activity, or a violation of the lease or rental agreement. Some states also include reasons such as health and safety violations or the sale of the rental unit as acceptable reasons for eviction.
Requirements for how and when landlords are required to file eviction documents with the court and how tenants must be notified that eviction documents have been filed vary by state and jurisdiction. The basic notion, however, is that when a tenant fails to pay rent, violates the terms of their lease, uses police services too often, or the rental unit faces health or code violations, the landlord files an eviction notice with the court. A trial date with the housing court is then set and the landlord and tenant have the right to present (or have their attorneys present) their cases.
Low-income tenants who are displaced are generally forced into substandard housing in poorer and higher-crime neighborhoods. Evictions cause psychological trauma, increase the likelihood of suicide, increase emergency room usage, decrease credit access, and lead to homelessness. This problem is especially traumatizing for children, impacting their emotional, social, and physical well-being, and increasing the likelihood of lead poisoning, food insecurity, and issues with academic performance.
The COVID-19 pandemic has exacerbated historical racial inequities in housing security, disproportionately affecting renter households and bringing the dangers of housing instability and evictions into stark relief. Eviction moratoriums and emergency protections for renters—in addition to quarantines and social distancing—can be an effective public health measure to prevent the spread of COVID-19. Effective from September 4, 2020 through December 31, 2020, the CDC’s Temporary Halt in Residential Evictions to Prevent the Further Spread of COVID-19 prevented covered individuals from being evicted or removed from their residences. To be eligible for protection under the order, renters must earn less than $99,000 for individuals or $198,000 for couples. The CDC’s most recent order extended the eviction moratorium through July 31, 2021, preventing the eviction of tenants who are unable to pay their rent, and was intended to be the final extension of the moratorium.
The common understanding of eviction is solely as a product of a landlord-tenant relationship: a failure of the tenant to pay or uphold some other responsibility. But this understanding leaves out the municipal rules surrounding eviction filings and how discrimination and devaluation of Black communities factor in.
Past studies highlight the link between evictions and Black communities
The effect of a neighborhood’s racial composition on evictions has been studied at the city and metropolitan level. The results have been mixed. An article in Housing Studies that looked at serial eviction filings in Atlanta (in which landlords file repeatedly against the same tenant) found that the share of the renter population that is Black has a stronger predictive value than the share of the renter population that is cost-burdened (paying over 30% of their income on rent). On the other hand, a study in Social Science Research that looked at Milwaukee during the Great Recession found that other neighborhood characteristics are predictive of eviction patterns, but racial composition does not, itself, impact eviction rates.
Most studies, however, do find a positive relationship between the Black population and evictions at the neighborhood and personal level. A study from the Federal Reserve Bank of Atlanta found that after looking at specific housing characteristics, the number of houses owned by each landlord, and other neighborhood characteristics in Fulton County, Ga., the racial composition of the neighborhood—particularly the Black resident percentage—contributes significantly to the number eviction filings. A study from Housing Policy Debate on Las Vegas found that while some past studies have overstated the numerical significance of the racial composition of the neighborhood, with controls, the Black percentage of a neighborhood still significantly impacts the likelihood of eviction.
We analyze evictions at the neighborhood level, as many others have before us. Neighborhood-level analysis allows us to study how landlords in specific localities interact with their tenants to see if there are differences between similarly situated tenants.
Our report looks nationally at eviction data from the Eviction Lab at Princeton University, tract-level data from the Census Bureau’s American Community Survey, and gentrification analysis using the 2000 census data on 2010 census tract boundaries from Social Explorer.
Looking at national data, we may lose some of the intricacies that local-level analysis is able to capture. Specifically, because we use Eviction Lab data, we only look at “formal” evictions. Formal evictions occur when landlords use the legal process to execute evictions, but formal evictions are only a small percentage of the ways that landlords force tenants out of their homes. Informal evictions have been on the rise, particularly during the pandemic; these methods include offering tenants a buy-out, failing to fix maintenance requests, and performing illegal lockouts. The Eviction Lab’s data also underestimates formal evictions and eviction filings, as a study from Geoforum confirmed in Lexington, Ky. However, the data is still useful for making intra-urban comparisons.
The undercounting may be more pronounced because renters know that the courts are not in their favor and are likely to leave before formal evictions are executed. An investigation by The Baltimore Sun found that although the judicial system is meant to hear problems from both landlords and tenants, “the [Baltimore City District] court works more as a collection agency for landlords than as a tool to correct housing problems.” A Fordham Urban Law Journal study found that having access to counsel greatly improved tenants’ chances in housing court, but while 90% of landlords are represented by an attorney, 90% of tenants are not. Even when inspectors find residences to be “illegal” or “unfit,” landlords still win 89% of the money held in escrow (the money the tenant is forced to pay for substandard or illegal housing). The landlord can then simply move on to renting to a new tenant without correcting the underlying violations.
This problem of anti-tenant courts further exacerbates racial disparities. A study in Housing Policy Debate found Black-majority neighborhoods have higher eviction rates than white neighborhoods, holding other neighborhood features equal—but that discrepancy can be somewhat improved by more tenant-friendly rental courts. In jurisdictions where eviction filings are cheap—such as Washington, D.C., where they cost only $15—filings are more common, and these costs are passed down to the tenant. In these cities, a study from Social Forces found property managers execute multiple eviction filings on the same household to regain late fees, and that Black-majority neighborhoods are more likely to experience these serial eviction filings.
As a study from Regional Science and Urban Economics showed, tenants choose to pay the costs of late fees and their own eviction filings rather than try to find new housing because finding housing is more difficult and more expensive after an eviction filing. Similarly, the two-month loss of rental revenue and turnover costs are not attractive to landlords; according to an ethnographic study by City and Community, landlords prefer long-term tenants.
While eviction filings are not as detrimental as being forcibly removed via an executed eviction, their consequences can still haunt people. A 2007 Yale Law Journal article—from a time when the practice of corporate collating of eviction records was in its infancy—pointed to these records’ problems; namely, that landlord screenings of this data show the actions of previous landlords, not necessarily the tenants themselves. Would-be tenants are often denied housing based on past eviction filings, even if they weren’t evicted.
“It is the policy of 99 percent of our customers in New York to flat out reject anybody with a landlord-tenant record, no matter what the reason is and no matter what the outcome is, because if their dispute has escalated to going to court, an owner will view them as a pain,” a national background check and leasing service representative told The New York Times in 2006. An eviction filing, regardless of the outcome, is functionally an indefinite blacklist for tenants trying to find new, high-quality housing. At the same time, a study in the Journal of Law and Social Policy found that “evictions due to foreclosure, unlawful retaliation, or even missed payments do not predict a tenant’s future behavior.”
The state of evictions in Black-majority neighborhoods
We use data from the Eviction Lab from 2012 to 2016 at the census tract or neighborhood level. In the 131 metropolitan areas we examined, there were averages of 1,880,053 eviction filings and 665,668 evictions per year. Each year, an average of 666,396 of these eviction filings (35.4%) and 181,495 of these evictions (27.2%) took place in Black-majority neighborhoods.
To understand racial disparities in evictions, we place the number of eviction filings and evictions in Black-majority neighborhoods in context with the number of people living in the Black-majority neighborhoods. Just over 10% of the population of these metro areas live in Black-majority neighborhoods. Therefore, we consider the ratio of Black neighborhood population to Black neighborhood eviction filings and evictions. For all of these metro areas, we thus have an eviction filing ratio of 3.39 and an eviction ratio of 2.6.
Eviction filings
First, to get the eviction filing ratio by metropolitan area, we look at the percentage of eviction filings occurring in Black-majority neighborhoods and divide it by the percentage of the population living in Black-majority neighborhoods.
The metropolitan area with the highest eviction filing ratio—the Poughkeepsie-Newburgh-Middletown, N.Y. metropolitan area—is an illustrative case. During the years of observation, about 2.5% of the population lived in Black-majority neighborhoods. And yet, of the average of 310 eviction filings that took place in this metro area each year from 2012 to 2016, 79 of them (25.6%) took place in Black-majority neighborhoods. This yields an eviction filing ratio of 10.4. Yet eviction filings are relatively low in this metro area, with 0.41 eviction filings per 100 renting households in the years of observation.

Evictions
Next, to obtain the eviction ratio by metropolitan area, we look at the percentage of evictions occurring in Black-majority neighborhoods and divide it by the percentage of the population living in Black-majority neighborhoods.
Once again, the Poughkeepsie-Newburgh-Middletown, N.Y. metro area has the highest eviction ratio. About 2.5% of the metro area population lived in Black-majority neighborhoods. And yet, of the average of 302 evictions that took place there each year from 2012 to 2016, 76 of them (25.3%) were in Black-majority neighborhoods. This yields an eviction ratio of 10.3, and there were 0.4 evictions per 100 renting households in the years of observation.

Although the Black ratios for eviction filings and evictions are high in the Poughkeepsie-Newburgh-Middletown metro area, the absolute rates for both are low. They are also relatively close: There are an average of 310 eviction filings each year and 302 evictions, or about 0.4 eviction filings and evictions per 100 renting households. This means that for most every eviction filing, an eviction was executed.
Such trends are not the case everywhere. Some metropolitan areas, such as the Washington, D.C. metro area, are quite different. About 18.6% of the Washington, D.C. metro area lived in Black-majority neighborhoods from 2012 to 2016. Of the average of 164,184 eviction filings that took place each year during that time, an average of 128,231 of them (78%) occurred in Black-majority neighborhoods. This gives an eviction filing ratio of 4.19. For every 100 renting households in the metro area, there were 20.4 eviction filings. Residents of Black-majority neighborhoods in the Washington, D.C. metro area are far more likely to see an eviction filing than in any other location in the metro area, but that does not mean that they were more likely to have an eviction executed against them.
Of the 2012-to-2016 average of 164,184 eviction filings each year in the Washington, D.C. metro area, only a yearly average of 10,823 evictions were executed. The metro area thus has 2.02 evictions for every 100 residents. So, unlike in Poughkeepsie, where an eviction filing most often led to an executed eviction, an eviction filing in the Washington, D.C. metro area most likely did not lead to an executed eviction. Of the 10,823 executed evictions, 4,065 (37.6%) were in Black-majority neighborhoods, leading to an eviction ratio of 2.01.
Eviction filings still have deleterious effects on renters, but without loss of a home. Because of low filing costs in Washington, D.C., landlords there use eviction filings with far more frequency than in other cities. According to a Washington Post opinion piece by Eva Rosen and Brian J. McCabe, “Landlords [in Washington, D.C.] are using the court system as a collection agency. This is an enormous burden on the system, needlessly dragging tenants to court and reducing the capacity of the court to arbitrate landlord-tenant disputes.”
This discrepancy between the eviction filing ratio and eviction ratio in the Washington, D.C. metro area further shows that while evictions against tenants living in Black-majority neighborhoods are higher, landlords in Black-majority neighborhoods in particular are willing to use eviction filings even when they are far less likely to lead to an eviction.
Visualizing eviction and eviction filing rates across different types of neighborhoods
Here, we document evictions and eviction filings from 131 metropolitan areas across the country at the neighborhood level. Some will argue that rates of eviction filings and evictions are higher in Black-majority neighborhoods due to lower incomes, higher poverty rates, fewer homeowners, and lower property values, thus making more renters vulnerable to eviction. To address this, we create typologies of neighborhoods for eviction filings and completed evictions with various metrics. For each of the factors we examine, we rank each tract within its respective metropolitan area and determine if it is in the top quarter. We compare neighborhoods in the top quarter of their respective metropolitan areas to neighborhoods not in the top quarter of their respective metropolitan areas, and we look at different Black-resident concentrations in the neighborhoods, from less than 1% Black to Black-majority, following our earlier work.
While it is difficult to do a direct comparison due to wildly different filing costs, eviction laws, and renter protections (both between different metro areas and between different cities within the same metro area), a clear trend emerges for Black-majority neighborhoods. Evictions, regardless of other factors, take place in greater density in Black-majority neighborhoods.

There are several factors to control for to predict differences in neighborhood eviction rates. A study from the American Journal of Sociology found that landlords perceive families with young children as unattractive because they are forced to do extra work for lead safety and other code violations, and Child Protective Services can force landlords to make these expenses. So, we account for the percentage of households with children under 18. Overall, eviction filings and eviction rates increased in neighborhoods with the most children under 18; however, in Black-majority neighborhoods with the most children, the eviction filing rate decreased while the eviction rate stayed the same.

An article from Social Forces found that neighborhoods with a higher number of children and female-headed households experience increased evictions, so we account for the percentage of female heads of household. Eviction filing and eviction rates increased for every neighborhood group in the top quarter of female-headed households.

We account for the percentage of bachelor’s degree holders, because educational attainment has a significant relationship with evictions according to the earlier referenced study from Housing Policy Debate that studied evictions in Las Vegas. However, while our analysis does show that overall, more highly educated neighborhoods see lower eviction filing rates and slightly lower eviction rates, that may reflect that Black households and Black neighborhoods generally have lower education outcomes than non-Black households and neighborhoods.

We also account for the percentage of workers in the service sector because of the precarity of their work, as did another study from Social Forces. While the eviction filing rate does increase for neighborhoods with a high concentration of service workers, it is not clear if this is due to the service workers themselves or Black workers being overrepresented in the service sector.

We account for gentrification using methodology developed by earlier work. In this piece, we classify a neighborhood as eligible for gentrification if, in 2000, the neighborhood had a population of at least 500 as well as a median household income and median home value below the 40th percentile compared to tracts within the metropolitan area. If all three of these criteria were not met, the neighborhood was classified as ineligible. Further, if the neighborhood was eligible for gentrification, we classify the neighborhood as gentrified if at the time of observation (2012 to 2016), the neighborhood was in the top third of neighborhoods in the metropolitan area for percentage of bachelor’s degree holders, had an inflation-adjusted increase in median home value, and the increase in home value was in the top third of the metro area. If any one— but not all—of those three factors were satisfied, we classified the tract as gentrifying. Tracts eligible for gentrification and those that are currently gentrifying have the highest rates of both evictions and eviction filings.

We examine median property value, because higher property values are associated with higher incomes and lower evictions. Higher home values significantly decrease eviction filings and evictions for both neighborhoods with few Black residents and Black-majority neighborhoods.

An article in Housing Policy Debate found that the vacancy rate was strongly related to eviction filings. So, we examine vacancy rates and find similarly, that vacant units increase eviction filings in particular for Black-majority neighborhoods, although the increase in executed evictions is negligible.

In neighborhoods with more rental housing units, the expectation would be for more evictions. However, because we examine the eviction filing and eviction rates, not the absolute numbers, we avoid this pitfall. Still, we find that neighborhoods with a higher percentage of renting households have higher eviction filing and eviction rates.

For cost-burdened households (households that pay more than 30% of their income on rent), it would be expected that eviction filing and eviction rates would be higher because tenants struggle more to keep up with rent. This expectation holds true for neighborhoods overall: Eviction filing and eviction rates increase as median rent as a percent of income increases. However, for Black-majority neighborhoods with a high number of cost-burdened households, while the eviction rate climbs, the eviction filing rate decreases. This suggests that in these neighborhoods, landlords are more likely to file evictions with the intent to evict, instead of with the intent to recoup unpaid rent.

Finally, we compare the percent of the population below 150% of the poverty line. Similar to neighborhoods with high median rent as a percent of income, it would be expected that eviction filing and eviction rates would be higher because tenants struggle more to keep up with rent. Again, this expectation holds true for neighborhoods overall: Eviction filing and eviction rates increase as poverty increases. However, for Black-majority neighborhoods in high-poverty neighborhoods, while the eviction rate climbs, the eviction filing rate decreases. This suggests that in these neighborhoods, landlords are more likely to file evictions with the intent to evict, instead of with the intent to recoup unpaid rent.

How to avert the coming eviction crisis
With the CDC eviction moratorium now expired, there are steps policymakers can take to reduce the harmful effects of evictions—in particular, for residents of Black-majority neighborhoods.
- First, in the same way that the criminally accused are entitled to counsel, tenants should be entitled to legal counsel in cases that have the potential to result in evictions. During the pandemic, some cities passed “right to counsel” legislation, and other cities and counties should consider similar legislation.
- Second, jurisdictions should increase the cost of eviction filings. In places where eviction filing costs are low (such as Washington, D.C.), eviction filings happen more frequently than in places with higher costs. Del. Eleanor Holmes Norton of the District of Columbia has called on the city government to increase the filing costs.
- Third, 911 nuisance laws are punishing domestic violence victims for seeking protection. Landlords with tenants experiencing domestic violence—disproportionately women—are often cited for excessive 911 usage, with the only remedy for the citation being eviction. The state should not seek to evict women for availing themselves of the only resource available to them at the most dangerous time in their lives.
- Fourth, expand rental assistance. Rental assistance works, but it’s underfunded and doesn’t reach most households that need it; for many, the wait times are too long to be helpful.
- Fifth, build more housing. In many cities, zoning laws prevent new housing stock from being added and restrict certain types of housing used by poor people and people of color—specifically, housing that is not single-family housing. Minneapolis changed their restrictive zoning laws just before the pandemic and became the first city to ban single-family zoning, with Berkeley and Sacramento, Calif. following suit this year. While the long-term effects on rent and availability remain to be seen, the reality is that for many cities without zoning reform, the status quo is untenable.
- Finally, increase the minimum wage. Evictions disproportionately hit renters with low incomes and those in poverty; nowhere in the country can a single working adult afford a two-bedroom apartment on the minimum wage.
The U.S. is currently facing a large-scale eviction crisis. But by understanding where the threat of evictions is highest and pursuing solutions accordingly, city, county, and state policymakers can consciously choose to avoid this crisis and prevent the displacement and disruption of millions of families.
Related Content


Authors